[Kaggle] 자전거 수요 예측(Bike Sharing Demand) (3)Modeling
3. Modeling
- 자전거의 일별 대여량을 예측하는 문제이므로 회귀(Regression) 모델을 사용합니다.
- 이 대회는 회귀 평가 지표중 하나인 RMSLE(Root Mean Squared Logarithmic Error) Score 로 평가합니다.
3.1. RMSLE

-
RMSLE 를 구하는 공식입니다.
-
Python 에서 RMSLE를 구해주는 라이브러리가 없으니 직접 함수로 만듭니다.
1 2 3 4 5 6 7 8 9 10 11 12 13 14 15 16 17 18 19 20 21 22 23 24 25 26 27 | # score 제작 준비 from sklearn.metrics import make_scorer # RMSLE 함수 정의 def RMSLE(predicted_values, actual_values): # 예측값과 실제 값을 numpy 배열 형태로 변환 predicted_values = np.array(predicted_values) actual_values = np.array(actual_values) # 예측값과 실제 값에 1을 더하고 로그 변환 log_predict = np.log(predicted_values + 1) log_actual = np.log(actual_values + 1) # 로그 변환한 예측값에서 로그 변환한 실제 값을 빼고 제곱 difference = log_predict - log_actual difference = np.square(difference) # 위에서 계산한 값의 평균 mean_difference = difference.mean() # 위에서 계산한 값에 루트 score = np.sqrt(mean_difference) return score rmsle_score = make_scorer(RMSLE) |
3.2. Model 선택
-
앙상블(Ensemble) 회귀 모델로 예측을 진행합니다.
- Random Foreset
- Adaboost
- Bagging
-
사용할 모델을 불러옵니다.
1 2 3 | from sklearn.ensemble import RandomForestRegressor # Random Forest from sklearn.ensemble import AdaBoostRegressor # AdaBoost from sklearn.ensemble import BaggingRegressor # Bagging |
3.3. K-Fold Cross Validation (교차검증)
- Train set 의 불균형을 방지하기 위해 K-Fold 교차검증을 이용해 모델의 성능을 테스트 합니다.
1 2 3 4 5 | # kfold 준비 from sklearn.model_selection import KFold, cross_val_score # kfold 설정 kfold = KFold(n_splits=10, random_state=1230, shuffle=True) |
- 3가지 모델 성능을 Kfold 교차검증을 사용해 테스트 해봅니다.
1 2 3 4 5 6 7 8 9 10 11 12 13 14 | # 사용할 모델 설정 models = [RandomForestRegressor(), AdaBoostRegressor(), BaggingRegressor()] regressors = ['RandomForest', 'AdaBoost', 'Bagging'] score_result = [] # Kfold 교차 검증 for x in models: Rgr = x score = cross_val_score(Rgr, X_train, target, cv=kfold, scoring=rmsle_score) score_result.append(score.mean()) # 결과를 dataframe 으로 변경 Kfold_score_result = pd.DataFrame({'Score' : score_result}, index=regressors) Kfold_score_result |

-
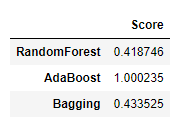
Score는 낮을 수록 성능이 좋다는 지표입니다.
-
RandomForest 을 선택하는 것이 좋아보입니다.
-
음… 그런데 이대로 끝내버리기에는 뭔가 아쉬운거 같습니다.
-
windspeed의 값이 0인 부분을 결측값이라고 생각하고 처리 후 비교해 봅시다.
3.4. ‘windspeed’ Feature Engineering
-
windspeed의 0 값을 0이 아닌 값으로 예측하여 넣어보도록 하겠습니다. -
모델은 Random Forest 로 진행합니다.
-
풍속과 관계가 있을 것 같은 Feature 로는
season,weather,humidity,temp,month,hour정도로 추릴 수 있을 것 같습니다. -
windspeed의 0의 값을 처리하는 파이프라인을 만듭니다.
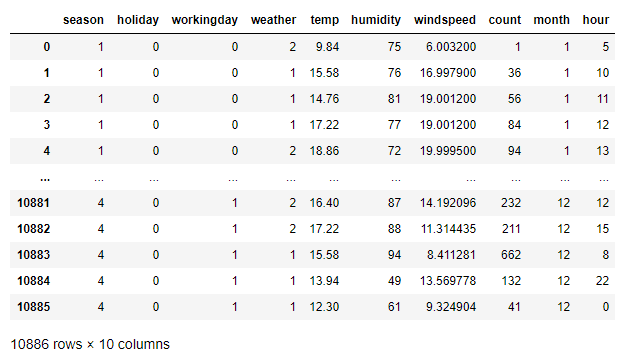
1 2 3 4 5 6 7 8 9 10 11 12 13 14 15 16 17 18 19 20 21 22 23 24 25 26 27 28 29 30 31 32 33 34 35 | train = pd.read_csv('train.csv') # month 와 hour feature train['datetime'] = pd.to_datetime(train['datetime']) train['month'] = train['datetime'].dt.month train['hour'] = train['datetime'].dt.hour # 범주형 변수들 category 타입으로 변경 train['season'] = train['season'].astype('category') train['weather'] = train['weather'].astype('category') train['month'] = train['month'].astype('category') train['hour'] = train['hour'].astype('category') # 사용하지 않는 feature 제거 drop_feature = ['datetime', 'casual', 'registered', 'atemp'] train.drop(drop_feature, inplace=True, axis=1) # windspeed 0과 0이 아닌 데이터 분리 train_wind0 = train[train['windspeed'] == 0] train_notwind0 = train[train['windspeed'] != 0] # modeling wind_col = ['season', 'weather', 'temp', 'humidity', 'month', 'hour'] model_wind = RandomForestRegressor() model_wind.fit(train_notwind0[wind_col], train_notwind0['windspeed']) # 예측 결과 추가 wind0_values = model_wind.predict(train_wind0[wind_col]) train_wind0['windspeed'] = wind0_values # 데이터 병합 new_train_data = train_notwind0.append(train_wind0).reset_index() new_train_data.drop('index', inplace=True, axis=1) new_train_data |

- 새로운 train set 을 만들었으니
windspeed가 얼마나 얼마나 영향을 줄지 테스트 해봅니다.
1 2 3 4 5 6 7 8 9 10 11 12 13 14 15 16 17 18 19 20 21 | # One-Hot encoding new_train_data = pd.get_dummies(new_train_data, columns=['season','weather']) # train set 과 target 설정 X_new_train_data = new_train_data.drop('count', axis=1) new_target = new_train_data['count'] # 사용할 모델 설정 models = [RandomForestRegressor(), AdaBoostRegressor(), BaggingRegressor()] regressors = ['RandomForest', 'AdaBoost', 'Bagging'] new_score_result = [] # Kfold 교차 검증 for x in models: new_Rgr = x new_score = cross_val_score(new_Rgr, X_new_train_data, new_target, cv=kfold, scoring=rmsle_score) new_score_result.append(new_score.mean()) # 결과를 dataframe 으로 변경 new_Kfold_score_result = pd.DataFrame({'new Score' : new_score_result}, index=regressors) new_Kfold_score_result |

-
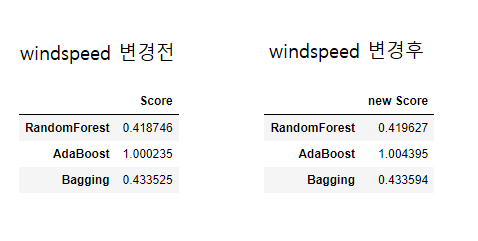
유의미한 변화를 기대했지만… 거의 변화가 없는 것을 볼 수 있습니다.(
뻘짓) -
windspeed는 자전거 대여량을 예측하는데 큰 영향을 주지 않는 것 같습니다. -
그냥
windspeed가 0인 것을 사용합니다. -
이번엔 Random Forest의 Parameter 를 수정해 봅니다.
3.5. Parameter Tunning
- RandomForestRegressor 에는 많은 Parameter 들이 존재합니다.
- 공식문서 에서 더 많은 내용을 찾을 수 있습니다.
- 이 중에서 나무의 수를 결정하는 n_estimators 를 수정해 봅니다. (default=100)
1 2 3 4 5 6 7 8 9 10 11 12 13 14 15 16 | # 랜덤포레스트 모델 사용준비 from sklearn.ensemble import RandomForestRegressor val = [10, 20, 30, 40, 50, 70, 100, 150, 200] result = [] for i in val: # 랜덤포레스트 모델 model = RandomForestRegressor(n_estimators=i) # kfold 교차 검증 score = cross_val_score(model, X_train, target, cv=kfold, scoring=rmsle_score) # score 평균 mean = score.mean() result.append(mean) |
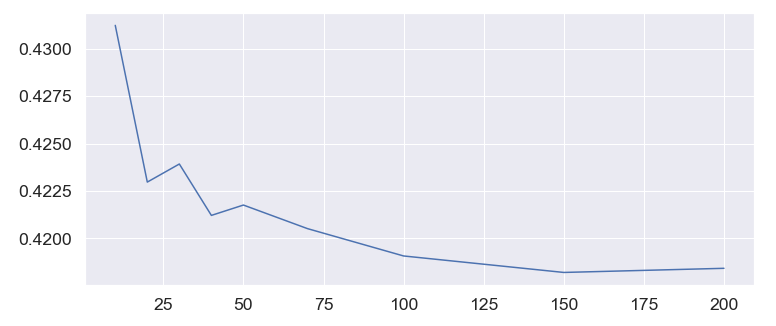
- 10부터 200까지의 숫자를 적절히 넣어주고 결과를 그래프화 합니다.
1 2 3 4 5 6 | fig, ax = plt.subplots(figsize=(12,5)) # x축은 n_estimators 값, y축은 score 의 평균 plt.plot(val,result) plt.show() |

- 값의 그래프를 보니 n_estimators 의 default 값인 100보다 150에서 아주 미세하게 더 성능이 좋은 것을 확인할 수 있습니다.
3.6. Submission
- Random Forest Regressor 를 사용하고 n_estimators 의 값은 150으로 사용합니다.
- 이제 submission 파일을 만들어 봅니다.
1 2 3 4 5 6 7 8 9 10 | # 학습 및 예측 final_model = RandomForestRegressor(n_estimators=150) final_model.fit(X_train, target) prediction = final_model.predict(test_data) # 예측 결과를 submission에 입력 submission['count'] = prediction # 제출 파일 submission.to_csv('bike submission2.csv', index=False) |
- submission 파일을 Kaggle에 제출 하고 score를 확인합니다.

- Score는 0.51131 로 테스트했던 성능보다 낮게 나왔습니다.(오버피팅의 문제가 있을지도…)
3.7. 마무리
-
회귀 문제를 연습해 보기에 괜찮은 문제인것 같습니다.
-
성능이 만족할 만큼 높게 나오지 않았기 때문에 개선이 많이 필요 할 것 같습니다.
-
분류 문제에서도 느꼈지만 데이터의 전처리가 매우매우매우 중요한 것 같습니다.
-
Category type 과 One-Hot encoding 에 대해서 좀 더 공부를 해봐야겠습니다. (이 부분은 나중에 실험 해볼 예정)
Kaggle 에 있는 수 많은 notebook 을 참고하며 공부했습니다.