[Python] plot에 text 넣기 (matplotlib, text, annotate)
Python에서 matplotlib을 이용해 시각화를 할 때, 그래프에 text를 넣는 방법에 대해 알아보겠습니다.
text를 추가하는 방법으로는 matplotlib.pyplot 의 text 와 annotate 가 있습니다.
하나씩 알아봅시다.
text
matplotlib.pyplot.text(x, y, s, fontdict=None, **kwargs)
기본적인 parameter 로는 x, y 에 좌표가 들어가고 s에 text를 넣어주면 됩니다.
몇가지 자주 사용될 parameter 를 살펴보겠습니다.
fig, ax = plt.subplots(figsize=(5,5))

ax.plot([1, 2, 3, 4])

ax.text(x=2,y=2.5,s='y=x') # text 삽입

plt.show()
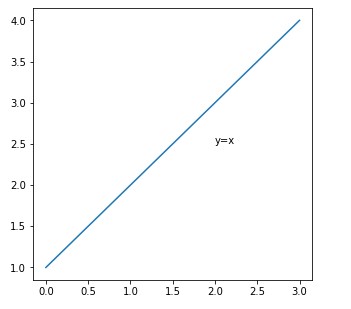
다음과 같이 원하는 위치에 text를 삽입할 수 있습니다.
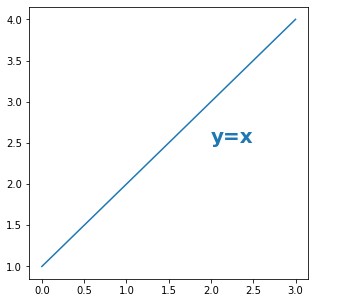
parameter를 이용해 text의 크기, 색 등을 변경할 수 있습니다.
fig, ax = plt.subplots(figsize=(5,5))

ax.plot([1, 2, 3, 4])

ax.text(x=2,y=2.5,s='y=x',
       fontsize=20,           # text 크기
       fontweight='semibold', # text 굵기
       color = 'tab:blue')    # text 색상

plt.show()
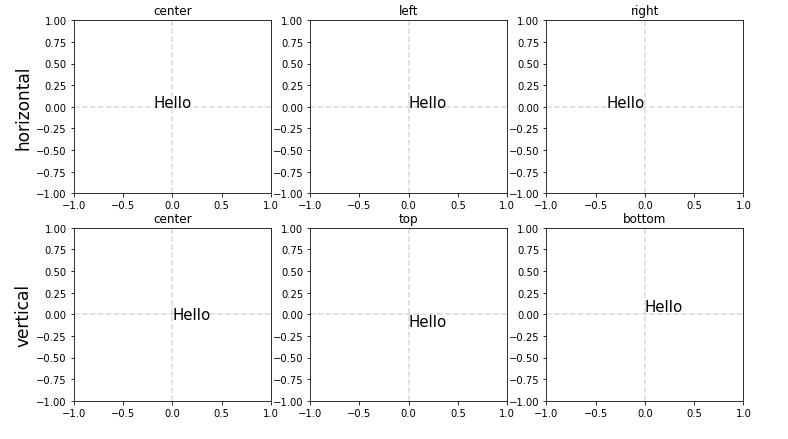
다음은 정렬 기능입니다.
수평 정렬인 horizontalalignment(ha) 와 수직 정렬인 verticalalignment(va) 을 사용할 수 있습니다.
어떤식으로 적용되는지 알아봅니다.
fig, ax = plt.subplots(2,3,figsize=(12,7))

for i in range(2):
    for j in range(3):
        ax[i][j].set_xlim(-1,1)
        ax[i][j].set_ylim(-1,1)
        ax[i][j].axvline(x=0, color='gray', ls='--', alpha=0.3)
        ax[i][j].axhline(y=0, color='gray', ls='--', alpha=0.3)

ax[0][0].set_ylabel('horizontal', fontsize=17)
ax[1][0].set_ylabel('vertical', fontsize=17)

ax[0][0].set_title('center')
ax[0][1].set_title('left')
ax[0][2].set_title('right')
ax[1][0].set_title('center')
ax[1][1].set_title('top')
ax[1][2].set_title('bottom')

# horizontalalignmnet
ax[0][0].text(x=0, y=0, s='Hello', fontsize=15, ha='center')
ax[0][1].text(x=0, y=0, s='Hello', fontsize=15, ha='left')
ax[0][2].text(x=0, y=0, s='Hello', fontsize=15, ha='right')

# verticalalignmnet
ax[1][0].text(x=0, y=0, s='Hello', fontsize=15, va='center')
ax[1][1].text(x=0, y=0, s='Hello', fontsize=15, va='top')
ax[1][2].text(x=0, y=0, s='Hello', fontsize=15, va='bottom')

plt.show()
이 외에도 text의 더 많은 parameter 는 공식문서를 참고하면 됩니다.
annotate
matplotlib.pyplot.annotate(text, xy, *args, **kwargs)
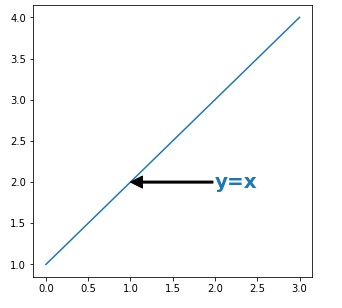
annotate는 단순히 text 뿐만 아니라 화살표로 위치를 나타냅니다.
annotate 는 화살표의 위치를 지정하는 것 외에는 위의 text와 사용방법과 유사합니다.
fig, ax = plt.subplots(figsize=(5,5))

ax.plot([1, 2, 3, 4])

ax.annotate(text='y=x',
            xytext=(2,2),  # text 좌표
            xy=(1,2),      # 화살표가 가르키는 좌표
            fontsize=20,   # text 크기
            fontweight='semibold',  # text 굵기
            color='tab:blue',     # text 색상
            arrowprops=dict(facecolor='black', width=2), # 화살표 설정
            va='center')  # 수직 정렬

plt.show()
수평 정렬, 수직 정렬은 위의 text 와 사용법이 같습니다.
annotate 역시 화살표의 모양부터 해서 다양한 parameter가 존재합니다.
더 자세한 내용은 공식문서에서 확인 할 수 있습니다.